USD CAD Forecast for 2026, 2027, 2028–2030 and Beyond
USD CAD Forecast for 2026, 2027, 2028–2030 and Beyond
The USDCAD pair is a major currency pair in the Forex market, reflecting the economic health of the United States and Canada, the two largest trading partners. The pair's fluctuations reflect not only the difference in interest rates and economic indicators of the respective countries, but also the state of the world commodity markets, especially oil, as Canada is a major exporter of energy commodities.
This article assesses the key forecasts for the coming years, provides fundamental and technical analysis, and evaluates the impact of global factors on the USDCAD exchange rate.
The article covers the following subjects:
- Major Takeaways
- USDCAD Real-Time Market Status
- USDCAD Price Forecast for 2026 Based on Technical Analysis
- Analysts' USDCAD Price Projections for 2027
- Analysts' USDCAD Price Projections for 2028
- Analysts' USDCAD Price Projections for 2029
- Analysts' USDCAD Price Projections for 2030
- Analysts' USDCAD Price Projections up to 2050
- USDCAD Market Sentiment in Social Media
- USDCAD Price History
- USDCAD Price Fundamental Analysis
- More Facts About USDCAD
- How We Make Forecasts
- Conclusion: Is USDCAD a Good Investment?
- USDCAD Price Prediction FAQs
Major Takeaways
- The current price of the USDCAD pair is CA$1.38249 as of 07.01.2026.
- The USDCAD pair reached its all-time high of CA$1.5848 on 27.08.1998. The pair's all-time low of CA$1.1191 was recorded on 04.11.1991.
- According to most forecasts, USD/CAD is expected to trade in the CA$1.3340–1.4010 range at the end of 2025.
- In the first half of 2026, the price is projected to fluctuate between CA$1.3100 and 1.3800, while in the second half of the year, the range may shift to CA$1.2790–1.3700.
- Export and import flows: The USDCAD rate may fluctuate due to changes in the US-Canada trade balance.
- Technical analysis: Under current market conditions, the USDCAD pair is expected to maintain a bullish trend, but it may reverse if the quotes pierce the key levels.
- According to forecasts, the USDCAD rate will depend on global economic growth, central banks' policy, and energy prices.
- Seasonal factors: Historically, the Canadian dollar has strengthened during periods of increased demand for export goods from Canada.
USDCAD Real-Time Market Status
The USDCAD currency pair is trading at CA$1.38249 as of 07.01.2026.
USDCAD current rate in the Forex market:
USDCAD = $1.38243
Sell
1.38243
Buy
1.38243
Sentiment
58.5%
1-day change
0.45 (0.00624%)
When analyzing the USDCAD pair, it is essential to consider the impact of macroeconomic indicators. Key factors include the monetary policies of the Bank of Canada and the US Federal Reserve. Inflation indicators, particularly the core consumer price index (CPI), are also crucial to monitor. In addition, historical levels of support and resistance, along with the past year's price performance, should be taken into account for a comprehensive analysis.
| Metric | Value |
| Bank of Canada's overnight interest rate | 2.25% |
| Core inflation rate | 2.9% |
| All-time low | 1.1191 CAD |
| All-time high | 1.5848 CAD |
| Rate change over 12 months | -3.27% |
USDCAD Price Forecast for 2026 Based on Technical Analysis
To assess USD/CAD's price dynamics over the medium and long term, we use technical analysis on the weekly time frame.
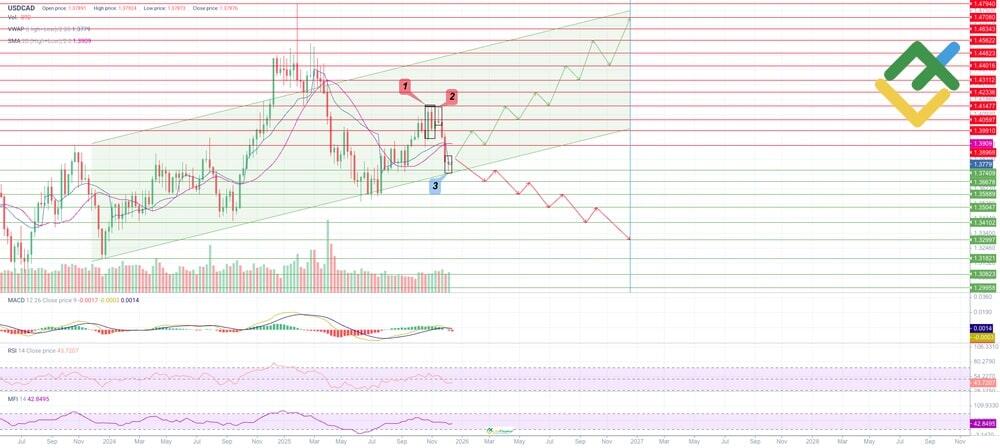
Since early November 2025, the currency pair has been correcting lower within a long-term uptrend and is currently holding near the lower boundary of the trend at 1.38249. Technical indicators and candlestick patterns are predominantly bearish regarding the pair's further movement.
- Near one of the key resistance levels at 1.4147, reversal candlestick patterns — Tweezer Top (1) and Shooting Star (2) — have formed, indicating increased selling pressure from this area. As a result, the price declined to the 1.3740 support level. There, a Spinning Top pattern (3) can be observed, signaling slowing bearish momentum and a temporary balance between buyers and sellers.
- MACD values have crossed below the zero line and remain in negative territory, which is a bearish sell signal.
- RSI is holding in neutral territory around 43, with room for both upward and downward movement.
- The Money Flow Index (MFI) is also moving sideways in the neutral zone, providing no clear buy or sell signals.
- VWAP and the SMA20 line are above the current market price, indicating increasing selling pressure on the pair.
Below are the projected price levels for USD/CAD over the next 12 months:
| Month | Minimum, CA$ | Maximum, CA$ |
| January 2026 | 1.3748 | 1.3876 |
| February 2026 | 1.3667 | 1.3864 |
| March 2026 | 1.3651 | 1.3754 |
| April 2026 | 1.3598 | 1.3704 |
| May 2026 | 1.3567 | 1.3670 |
| June 2026 | 1.3510 | 1.3679 |
| July 2026 | 1.3489 | 1.3585 |
| August 2026 | 1.3482 | 1.3607 |
| September 2026 | 1.3410 | 1.3514 |
| October 2026 | 1.3388 | 1.3545 |
| November 2026 | 1.3460 | 1.3604 |
| December 2026 | 1.3567 | 1.3673 |
Long-Term Trading Plan for USD/CAD for 2026
The technical analysis of the weekly USD/CAD chart has allowed us to identify key support and resistance levels to be used in a trading strategy for the coming year.
Trading Plan for the Year
- The price is likely to break below the lower boundary of the uptrend and continue to fall.
- Key support levels: 1.3740, 1.3667, 1.3588, 1.3504, 1.3410, 1.3299, 1.3182, 1.3082, 1.2995.
- Key resistance levels: 1.3896, 1.3991, 1.4059, 1.4147, 1.4233, 1.4311, 1.4401, 1.4482, 1.4562, 1.4634, 1.4708, 1.4794.
- The main long-term scenario: open short positions below the key support level at 1.3740, with potential targets in the 1.3667–1.2995 area. Time frame: 12 months.
- The alternative long-term scenario: open long positions above the main resistance line at 1.3896, with potential targets around 1.3991–1.4794.
Analysts' USD/CAD Price Projections for 2026
Until the end of 2025, USDCAD will likely remain volatile amid global economic uncertainty. In 2026, the pair is expected to stabilize, possibly with a slight strengthening of the Canadian dollar by year-end, provided oil prices remain stable and Canada's economy continues to grow steadily.
LongForecast
Price range (CAD): 1.2790 – 1.4010.
According to LongForecast, the pair could reach 1.3540 in early 2026. Analysts expect mixed price action by mid-year, with a close at 1.3700 at the end of June. By the end of the year, the pair is expected to decline and then settle around 1.3110.
| Month | Opening price, CA$ | Min.–Max., CA$ | Closing price, CA$ |
| January | 1.3540 | 1.3130–1.3730 | 1.3330 |
| February | 1.3330 | 1.3100–1.3500 | 1.3300 |
| March | 1.3300 | 1.3190–1.3590 | 1.3390 |
| April | 1.3390 | 1.3370–1.3770 | 1.3570 |
| May | 1.3570 | 1.3250–1.3650 | 1.3450 |
| June | 1.3450 | 1.3450–1.3910 | 1.3700 |
| July | 1.3700 | 1.3360–1.3760 | 1.3560 |
| August | 1.3560 | 1.3300–1.3700 | 1.3500 |
| September | 1.3500 | 1.2900–1.3500 | 1.3100 |
| October | 1.3100 | 1.2830–1.3230 | 1.3030 |
| November | 1.3030 | 1.2790–1.3170 | 1.2980 |
| December | 1.2980 | 1.2910–1.3310 | 1.3110 |
WalletInvestor
Price range (CAD): 1.3520 – 1.4130.
Analysts at WalletInvestor forecast mixed price action for the trading instrument throughout 2026. At the beginning of the year, the opening price is expected to be around 1.3760. In the first half of the year, the price may fluctuate moderately, with the rate steadying near 1.3800 by the end of June. In the second half of the year, quotes will likely continue rising and reach 1.4100 by the end of December.
| Month | Opening price, CA$ | Closing price, CA$ | Minimum price, CA$ | Maximum price, CA$ |
| January | 1.3760 | 1.3840 | 1.3760 | 1.3840 |
| February | 1.3840 | 1.3850 | 1.3800 | 1.3850 |
| March | 1.3850 | 1.3860 | 1.3850 | 1.3920 |
| April | 1.3850 | 1.3770 | 1.3770 | 1.3850 |
| May | 1.3780 | 1.3780 | 1.3780 | 1.3800 |
| June | 1.3770 | 1.3800 | 1.3750 | 1.3800 |
| July | 1.3790 | 1.3760 | 1.3740 | 1.3800 |
| August | 1.3760 | 1.3810 | 1.3760 | 1.3830 |
| September | 1.3810 | 1.3880 | 1.3800 | 1.3880 |
| October | 1.3890 | 1.4020 | 1.3890 | 1.4020 |
| November | 1.4020 | 1.4070 | 1.4020 | 1.4070 |
| December | 1.4080 | 1.4100 | 1.4080 | 1.4130 |
CoinCodex
Price range (CAD): 1.3100 – 1.3800.
CoinCodex's experts project an average price of $1.3400 at the beginning of 2026. The price is expected to show mixed fluctuations throughout the year, but remain within an uptrend. By the end of the first half of the year, quotes will likely correct down to 1.3200 and return to the 1.3400–1.3600 range by year-end.
| Month | Minimum, CA$ | Average price, CA$ | Maximum, CA$ |
| January | 1.3300 | 1.3400 | 1.3600 |
| February | 1.3300 | 1.3400 | 1.3500 |
| March | 1.3100 | 1.3200 | 1.3400 |
| April | 1.3300 | 1.3300 | 1.3400 |
| May | 1.3300 | 1.3400 | 1.3500 |
| June | 1.3100 | 1.3200 | 1.3400 |
| July | 1.3100 | 1.3200 | 1.3400 |
| August | 1.3300 | 1.3300 | 1.3500 |
| September | 1.3300 | 1.3400 | 1.3500 |
| October | 1.3500 | 1.3500 | 1.3600 |
| November | 1.3500 | 1.3600 | 1.3700 |
| December | 1.3300 | 1.3400 | 1.3500 |
Analysts' USDCAD Price Projections for 2027
Forecasts for 2027 are more uncertain. The actual outlook will depend on many factors, including central bank monetary policy, trade relations between the US and Canada, and the geopolitical environment.
Note: The price ranges reflect the asset's expected volatility throughout the year. Lows and highs may not be shown in the summary tables.
LongForecast
Price range (CAD): 1.3110 – 1.4440.
By early 2027, according to LongForecast, the pair is expected to trade between 1.3110 and 1.4140. By the end of June, the price may settle around 1.3780. The annual high is expected at 1.4440 in December. By year-end, the asset will likely stabilize near 1.4230.
| Quarter | Opening price, CA$ | Min.–Max., CA$ | Closing price, CA$ |
| Q1 | 1.3110 | 1.3110–1.4140 | 1.3930 |
| Q2 | 1.3930 | 1.3440–1.4170 | 1.3780 |
| Q3 | 1.3780 | 1.3470–1.4140 | 1.3930 |
| Q4 | 1.3930 | 1.3670–1.4440 | 1.4230 |
WalletInvestor
Price range (CAD): 1.4080 – 1.4470.
WalletInvestor forecasts the pair at around 1.4110 at the beginning of 2027. In the first half of the year, the price may rise slightly, reaching 1.4140 by the end of June. The bullish trend is expected to continue in the second half of the year. By the end of December, the asset's quotes may reach 1.4450.
| Quarter | Opening price, CA$ | Closing price, CA$ | Minimum price, CA$ | Maximum price, CA$ |
| Q1 | 1.4110 | 1.4200 | 1.4100 | 1.4260 |
| Q2 | 1.4190 | 1.4140 | 1.4090 | 1.4200 |
| Q3 | 1.4140 | 1.4220 | 1.4080 | 1.4220 |
| Q4 | 1.4240 | 1.4450 | 1.4240 | 1.4470 |
CoinCodex
Price range (CAD): 1.2000 – 1.4100.
According to CoinCodex data, the asset's price may settle in the 1.2500–1.4100 range by the end of the first quarter of 2027. By mid-year, experts expect quotes to decline to 1.2400, then reverse higher. In the second half of the year, the price is projected to rise to 1.2900.
| Quarter | Minimum, CA$ | Average price, CA$ | Maximum, CA$ |
| Q1 | 1.2500 | 1.2700 | 1.4100 |
| Q2 | 1.2000 | 1.2400 | 1.2700 |
| Q3 | 1.2300 | 1.2600 | 1.2700 |
| Q4 | 1.2600 | 1.2900 | 1.3100 |
Analysts' USDCAD Price Projections for 2028
Most conservative forecasts suggest a moderate decline in USD/CAD in 2028, driven by a potential recovery in the Canadian economy and the stabilization of oil prices.
LongForecast
Price range (CAD): 1.3390 – 1.4500.
LongForecast's experts anticipate mixed price action for the trading instrument in 2028. At the start of the year, the price is forecast to be around 1.4230. In the first half of the year, USD/CAD is likely to hold near the same level. Mixed dynamics are also expected in the second half of the year. The projected year-end close is 1.3930.
| Quarter | Opening price, CA$ | Min.–Max., CA$ | Closing price, CA$ |
| Q1 | 1.4230 | 1.3390–1.4230 | 1.3880 |
| Q2 | 1.3880 | 1.3740–1.4500 | 1.4230 |
| Q3 | 1.4230 | 1.3680–1.4230 | 1.3960 |
| Q4 | 1.3960 | 1.3620–1.4390 | 1.3930 |
WalletInvestor
Price range (CAD): 1.4430 – 1.4810.
According to data from the analytical portal WalletInvestor, the currency pair is expected to trade around 1.4450 at the beginning of 2028. In the first half of the year, quotes are likely to move moderately higher, reaching 1.4490 by the end of June. In the second half of the year, the upward momentum may strengthen, pushing the price to 1.4790 by the end of December.
| Quarter | Opening price, CA$ | Closing price, CA$ | Minimum price, CA$ | Maximum price, CA$ |
| Q1 | 1.4450 | 1.4550 | 1.4440 | 1.4600 |
| Q2 | 1.4540 | 1.4490 | 1.4440 | 1.4540 |
| Q3 | 1.4490 | 1.4580 | 1.4430 | 1.4580 |
| Q4 | 1.4580 | 1.4790 | 1.4580 | 1.4810 |
CoinCodex
Price range (CAD): 1.1600 – 1.3300.
According to CoinCodex's data, the asset is expected to show mixed price action in 2028. By the end of the first quarter, the price will likely reach 1.2900. In the second and third quarters, the price may decline to 1.1800, and then recover to 1.2300 by year-end.
| Quarter | Minimum, CA$ | Average price, CA$ | Maximum, CA$ |
| Q1 | 1.2500 | 1.2900 | 1.3000 |
| Q2 | 1.2500 | 1.2800 | 1.3300 |
| Q3 | 1.1600 | 1.1800 | 1.2500 |
| Q4 | 1.2000 | 1.2300 | 1.2400 |
Analysts' USDCAD Price Projections for 2029
Experts are divided in their forecasts for USDCAD in 2029. Some expect further strengthening of the Canadian dollar due to economic diversification, while others predict a stronger USD, pointing out risks of a global economic slowdown.
LongForecast
Price range (CAD): 1.3430 – 1.4970.
According to LongForecast, USD/CAD is expected to trade at around 1.3930 at the beginning of 2029. By mid-year, the instrument may rise to 1.4320. In the third quarter, the price is expected to grow to 1.4750, while by year-end, the asset may reverse lower and reach 1.4590.
| Quarter | Opening price, CA$ | Min.–Max., CA$ | Closing price, CA$ |
| Q1 | 1.3930 | 1.3430–1.4260 | 1.3630 |
| Q2 | 1.3630 | 1.3630–1.4620 | 1.4320 |
| Q3 | 1.4320 | 1.4120–1.4970 | 1.4750 |
| Q4 | 1.4750 | 1.4290–1.4810 | 1.4590 |
WalletInvestor
Price range (CAD): 1.4770 – 1.5160.
WalletInvestor expects the asset to trade around 1.4790 at the beginning of 2029. The price is forecast to rise to 1.4830 by the end of June. In the second half of the year, the bullish rally may strengthen, pushing the price to 1.5140.
| Quarter | Opening price, CA$ | Closing price, CA$ | Minimum price, CA$ | Maximum price, CA$ |
| Q1 | 1.4790 | 1.4890 | 1.4790 | 1.4950 |
| Q2 | 1.4890 | 1.4830 | 1.4780 | 1.4890 |
| Q3 | 1.4830 | 1.4920 | 1.4770 | 1.4920 |
| Q4 | 1.4920 | 1.5140 | 1.4920 | 1.5160 |
CoinCodex
Price range (CAD): 1.1800 – 1.3100.
CoinCodex's experts forecast an average price of around 1.2400 by the end of the first quarter of 2029. By mid-year, the price is expected to rise to 1.2600. In the third quarter, a decline to 1.2500 is projected, followed by a recovery to 1.2900 by year-end.
| Quarter | Minimum, CA$ | Average price, CA$ | Maximum, CA$ |
| Q1 | 1.1800 | 1.2400 | 1.2600 |
| Q2 | 1.2100 | 1.2600 | 1.2800 |
| Q3 | 1.2400 | 1.2500 | 1.2800 |
| Q4 | 1.2300 | 1.2900 | 1.3100 |
Analysts' USDCAD Price Projections for 2030
By 2030, the global economic environment may become more unpredictable. If US interest rates rise, USDCAD may move higher. However, more pessimistic forecasts link the pair's outlook to a potential recession.
WalletInvestor
Price range (CAD): 1.5110 – 1.5490.
WalletInvestor's experts expect bullish price action for the instrument in 2030. The year is forecast to open around 1.5140. Then, quotes may rise slightly to 1.5170. By the end of December, the uptrend will likely strengthen, pushing the price to 1.5490.
| Quarter | Opening price, CA$ | Closing price, CA$ | Minimum price, CA$ | Maximum price, CA$ |
| Q1 | 1.5140 | 1.5240 | 1.5130 | 1.5290 |
| Q2 | 1.5230 | 1.5170 | 1.5120 | 1.5230 |
| Q3 | 1.5170 | 1.5260 | 1.5110 | 1.5260 |
| Q4 | 1.5270 | 1.5490 | 1.5270 | 1.5490 |
CoinCodex
Price range (CAD): 1.2500 – 1.3100.
CoinCodex's analysts suggest that by the end of the first quarter of 2030, the asset will trade around 1.2900. In the first half of the year, the price is expected to decline gradually, reaching 1.2800 by June. In the second half of the year, the negative trend will likely persist, with quotes falling further to 1.2700 by December.
| Quarter | Minimum, CA$ | Average price, CA$ | Maximum, CA$ |
| Q1 | 1.2600 | 1.2900 | 1.3100 |
| Q2 | 1.2600 | 1.2800 | 1.3000 |
| Q3 | 1.2500 | 1.2800 | 1.2900 |
| Q4 | 1.2500 | 1.2700 | 1.2800 |
Gov Capital
Price range (CAD): 1.2121 – 1.5447.
Gov Capital's experts provide a mixed outlook for USD/CAD price movement throughout 2030. At the beginning of the year, the average price is expected to trade around 1.3734. The price is then forecast to decline to 1.3547, followed by stabilization near 1.4043 by year-end.
| Quarter | Minimum, CA$ | Average price, CA$ | Maximum, CA$ |
| Q1 | 1.2219 | 1.3734 | 1.5261 |
| Q2 | 1.2121 | 1.3547 | 1.5219 |
| Q3 | 1.2161 | 1.3732 | 1.5105 |
| Q4 | 1.2284 | 1.4043 | 1.5447 |
Analysts' USDCAD Price Projections up to 2050
A huge number of interconnected factors influence currency pairs such as USD/CAD, and these factors change over time, making forecasts over such a distant horizon impossible. The state of both the Canadian and US economies 15–25 years from now is highly unpredictable. Changes in trade relations, inflation, public debt, employment levels, and interest rates are all factors that are difficult to assess even for the coming years, let alone over a longer time frame.
Geopolitical risks also add significant uncertainty. Wars, political upheavals, new alliances, and conflicts can have a serious impact on currency stability. In addition, technological progress may lead to disruptive changes in the global economy, creating new industries and dismantling old ones. The development of cryptocurrencies and digital currencies may also affect traditional currency markets.
Given all these variables, any attempt to forecast the USD/CAD exchange rate for 2040–2050 would remain highly speculative.
USDCAD Market Sentiment in Social Media
Media sentiment reflects the overall investor outlook on USD/CAD, expressed through posts, comments, and analysis. Positive sentiment can drive the pair higher, while negative sentiment may trigger a decline. Sentiment analysis helps anticipate short-term price fluctuations.
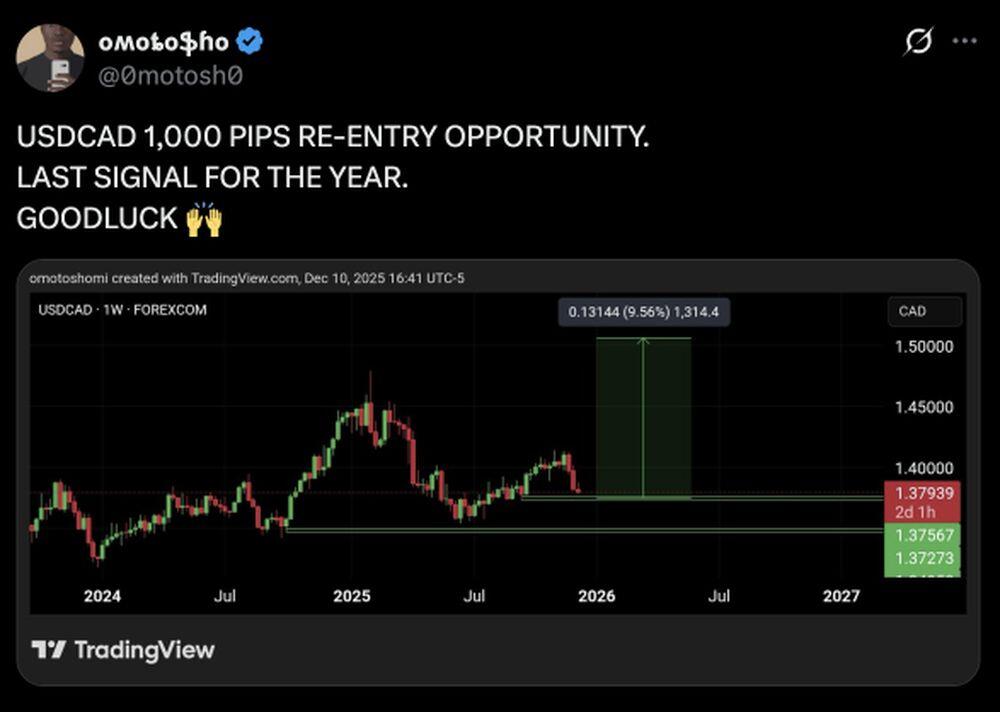
For example, an X (formerly Twitter) user under the handle @0motosh0 expects potential growth over the next six months to the CA$1.5000 area.
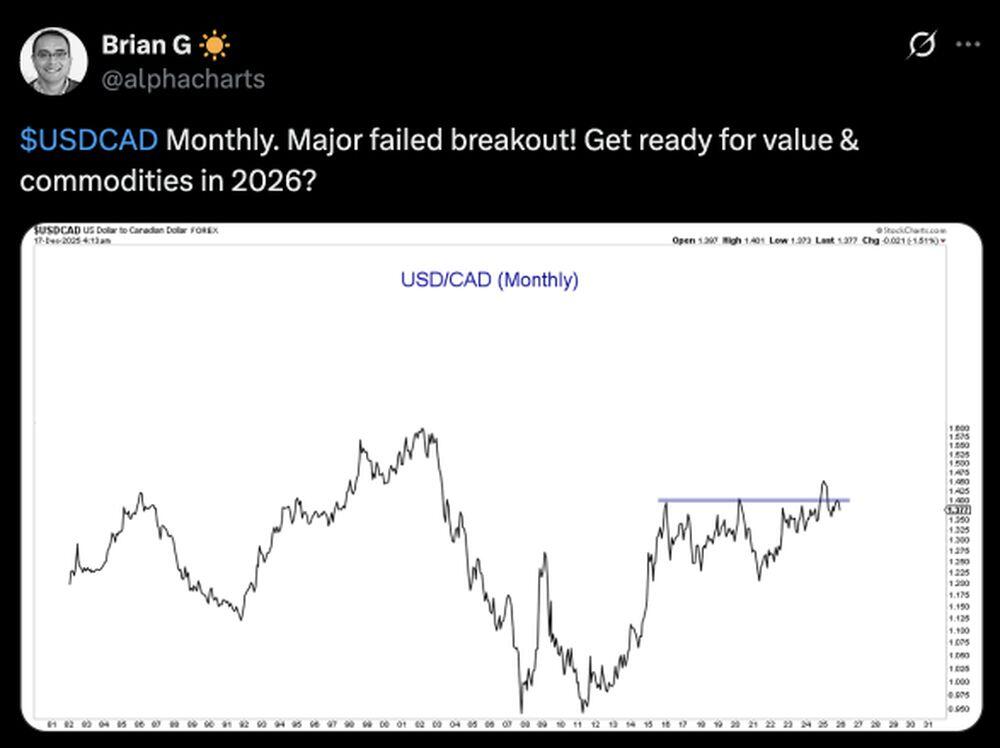
Independent expert @alphacharts highlights a failed attempt to break above the strong resistance near CA$1.4000 and expects commodity prices to rise in 2026. If this scenario plays out, the Canadian dollar may strengthen against the US dollar.
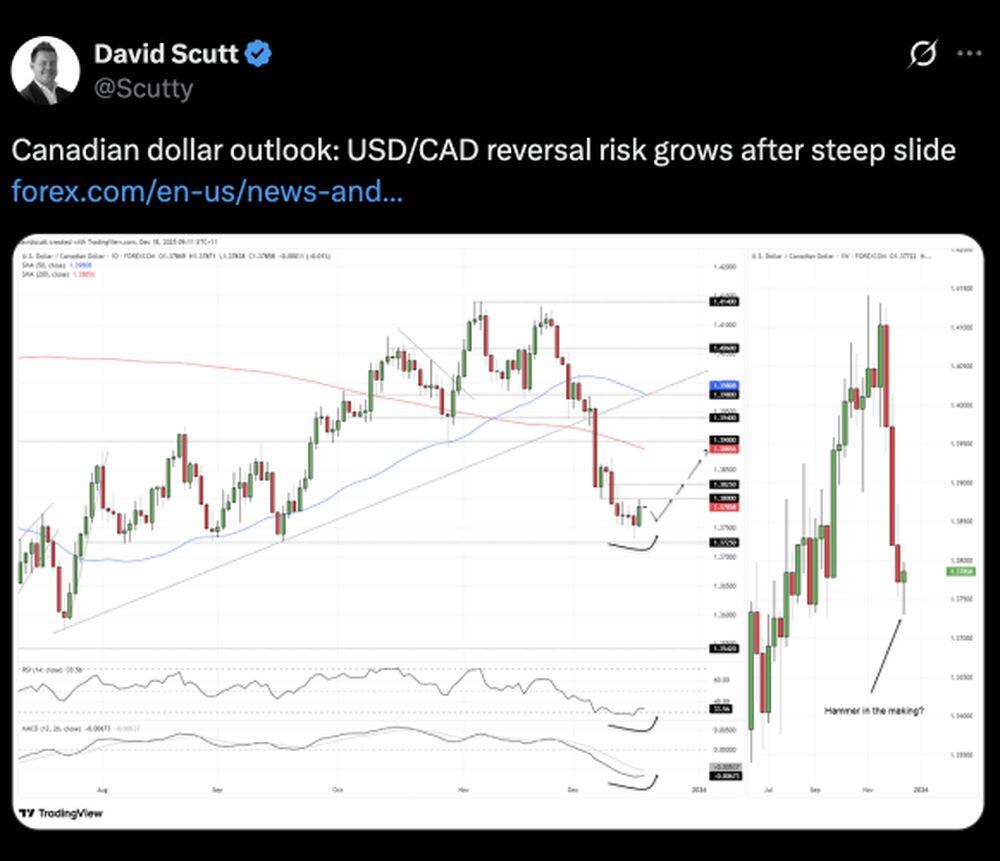
Independent analyst @Scutty points to a potential upside reversal in USD/CAD toward CA$1.3900 following a sharp decline.
Opinions among users are divided regarding the pair's next move, but most experts still see upside potential in the near term.
USDCAD Price History
The USDCAD pair reached its all-time high of CA$1.5848 on 27.08.1998.
The lowest price of the USDCAD pair was recorded on 04.11.1991 and reached CA$1.1191.
USDCAD online price chart in the Forex market in real time:
Below is a chart showing the USDCAD pair's performance over the last ten years. In this connection, it is important to evaluate historical data to make predictions as accurate as possible.
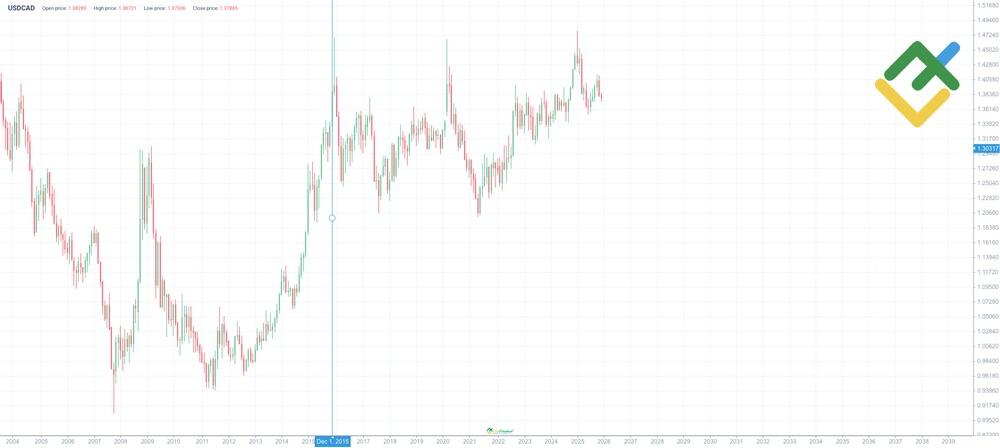
As you can see on the chart, the USDCAD currency pair has experienced significant fluctuations, reflecting changes in the US and Canadian economies. In the early 1990s, the pair traded between 1.15 and 1.40, but the Canadian dollar strengthened in 2002. The USDCAD has since declined to 1.10, driven by rising oil prices and a robust Canadian economy.
The global financial crisis of 2008 led to a significant shift in the investment landscape, with investors seeking out safe-haven assets. As a result, the Canadian dollar weakened significantly, and the USDCAD rate surged above 1.30. In the following years, the price of the pair fluctuated between 0.95 and 1.10, responding to shifts in commodity markets.
Between 2015 and 2020, USDCAD quotes rose steadily, reaching 1.45 amid the pandemic and falling oil prices. Between 2022 and 2023, the pair traded within the range of 1.32–1.40.
Between January and October 2024, the USDCAD pair fluctuated between CA$1.3287 and CA$1.3946. In November 2024, the rate began to rise, reaching CA$1.4467 by the end of the year.
Throughout 2025, USD/CAD showed significant volatility. At the start of the year, the pair traded near 1.4374, then surged to 1.4793 amid recession concerns. From February to mid-July, the price fell steadily, reaching 1.3596. From late July to early November, the pair rebounded, reaching 1.4005, then declined again and settled around 1.3782, reflecting broader market uncertainty.
USDCAD Price Fundamental Analysis
A fundamental analysis of the USDCAD rate involves analyzing the macroeconomic factors that drive the currency pair's quotes. The primary factors influencing the rate's fluctuations include the monetary policy of the US Federal Reserve and the Bank of Canada, the economic conditions of both countries, and oil prices.
What Factors Affect the USDCAD Pair?
- Fed and BoC monetary policy. Interest rate differentials affect the attractiveness of each currency.
- Oil prices. Canada is a major exporter of oil, an increase in its value strengthens the CAD.
- Economic data. GDP, unemployment rate, inflation, and trade balance data affect the exchange rate.
- Recession risks and geopolitical factors. Economic crises and conflicts prompt investors to turn to safe-haven assets.
- Bond yield spread. Investors prefer currencies with higher government bond yields.
- Investor sentiment and capital flows. Investment inflows into the US or Canada have a positive effect on their currencies.
More Facts About USDCAD
USDCAD is a major currency pair in the Forex market, offering high liquidity due to the high volume of trade between the United States and Canada.
The Canadian dollar, often referred to as the "Loonie," has historically been correlated with oil prices. As Canada is one of the world's leading energy exporters, rising oil prices tend to strengthen the Canadian dollar, while falling prices often weaken it.
Investors, traders, and central banks use the USDCAD pair to assess macroeconomic trends and make monetary policy decisions. The pair is also in demand by exporters and importers of both countries and international investors seeking to hedge currency risks. The fluctuations in the USDCAD rate are attributed to economic data, the policies of the Fed and the Bank of Canada, and global economic conditions. Due to its high volatility, this pair remains popular among traders and investors.
Advantages and Disadvantages of Investing in USDCAD
Investing in the USDCAD presents a range of opportunities for traders and investors. Its high liquidity and ease of forecasting make this pair attractive for trading. However, it is essential to remember that there are inherent risks.
Advantages
- High liquidity. The USDCAD pair boasts high liquidity, making it a popular choice for traders and investors. The pair's trading volume is exceptionally high, and it is traded on one of the world's largest Forex markets, ensuring minimal spreads and fast order execution.
- Predictability. The USDCAD rate is closely linked to oil prices, as well as to the monetary policy of the Fed and the BoC.
- Hedging opportunities. The pair is popular among traders and investors who use it to protect against currency risks in international transactions and investments.
- Accessibility. The currency pair is available on all major trading platforms, and trading costs remain low due to high liquidity.
- Suitable for various strategies. The versatility of the USDCAD pair makes it suitable for a range of strategies, including day trading, scalping, and long-term investments.
Disadvantages
- Dependence on oil prices. The Canadian dollar's value is closely tied to the global price of oil. Significant fluctuations in the price of oil can lead to high volatility.
- Macroeconomic risks. Given that Canada has an export-oriented economy, the exchange rate is influenced by the global economy, trade agreements, and tariffs.
- Volatility risk. Market news, central bank announcements, or sudden changes in oil prices may affect the exchange rate significantly.
- Political factors. Trade disputes between Canada and the US, as well as geopolitical uncertainty, can also impact the major currency pair.
- Interest rates. Changes in the monetary policy of the Bank of Canada and the Fed can cause sharp movements of USDCAD quotes, which can complicate long-term trading.
How We Make Forecasts
Forecasting the USDCAD rate requires a thorough analysis of short-, medium-, and long-term factors. Our approach integrates technical and fundamental analysis.
Short-term forecasts up to three months are based on technical analysis, including support and resistance levels, candlestick patterns, and indicators such as the RSI, MACD, and Bollinger Bands. In addition, we take into account news, macroeconomic statistics from the US and Canada, and oil market volatility.
Medium-term forecasts from 3 months to a year include an assessment of the monetary policy of the US Federal Reserve and the Bank of Canada, inflation rates, GDP growth, employment and trade balance data. The impact of oil prices and commodity markets is also analyzed.
Long-term forecasts extend over a period of one year or more and are based on estimates of economic growth, demographic trends, changes in trade agreements between the US and Canada, and global currency market trends.
Conclusion: Is USDCAD a Good Investment?
Whether USD/CAD is a good investment depends on an investor's strategy and risk tolerance. The pair is influenced by many factors, making it relatively volatile.
It may offer opportunities for short-term trading, but long-term investment requires careful analysis and diversification. Investors seeking stability may want to consider other assets.
Before investing, it is important to thoroughly assess all factors affecting the exchange rate and remember that past performance does not guarantee future results. Overall, USD/CAD is a moderate-risk asset with profit potential, requiring a disciplined and informed approach.
USDCAD Price Prediction FAQs
What is the current price of the USDCAD pair?
What is the Canadian dollar to US dollar exchange rate forecast for 2025?
Is the USDCAD pair a buy or sell?
Will the Canadian dollar strengthen against the US dollar?
What factors influence the current USDCAD exchange rate forecast?
What upcoming events could affect the USDCAD rate?
Why are USDCAD quotes falling?
Price chart of USDCAD in real time mode
Periods
- M1
- M5
- M15
- M30
- H1
- H4
- D1
- W1
Zoom1D1W1M3M6M1YALL14. Jul11. Aug8. Sep6. Oct3. Nov1. Dec29. DecJul '24Jan '25Jul '25J…1.351.361.371.381.391.41.411.42
The content of this article reflects the author’s opinion and does not necessarily reflect the official position of LiteFinance broker. The material published on this page is provided for informational purposes only and should not be considered as the provision of investment advice for the purposes of Directive 2014/65/EU.
According to copyright law, this article is considered intellectual property, which includes a prohibition on copying and distributing it without consent.