Order Flow Trading with Footprint Charts: Master Advanced Market Analysis
Order Flow Trading with Footprint Charts: Master Advanced Market Analysis
In finance, understanding what drives price movements gives traders an edge. Traditional technical analysis often fails to capture the full market dynamics. This is where order flow analysis proves its value. By examining how buy and sell orders are matched and executed in real time, traders gain a more accurate view of the market.
Order flow trading reveals where large market orders are executed, letting you make decisions based on actual trading activity rather than theory. Tools like the footprint chart offer new ways to analyze market behavior. This article explains how to trade order flow with foot print charts.
The article covers the following subjects:
- Major Takeaways
- What Is Order Flow Trading and Why It Matters
- Understanding Footprint Charts: Volume Cluster Analysis
- How to Read Footprint Chart: Decoding Market Information
- Key Order Flow Trading Patterns in Footprint Charts
- Order Flow Trading Strategies Using Footprint Charts
- Platforms for Order Flow Analysis and Footprint Trading
- Conclusion
- Order Flow Trading with Footprint Charts FAQs
Major Takeaways
- Order flow in trading involves analyzing the flow of trades to determine whether bulls or bears are currently dominating the market.
- A footprint chart is a primary tool for visualizing order flow. It displays each candlestick with the volume of executed buy and sell orders at particular price levels.
- Order flow trading makes it possible to track the actions of institutional traders whose orders influence price movement.
- Footprint, or cluster, charts provide a more detailed analysis of trading volume than the standard volume histograms displayed below a price chart.
- Delta is a key element of this analysis, as it represents the net difference between aggressive buying and selling volume.
- The key concept of the method is absorption, where the price remains stable despite a strong flow of market orders.
- Order flow trading is particularly effective in scalping and intraday strategies, where utmost accuracy is crucial.
- Delta divergence and market imbalances are powerful signals for predicting potential price movements.
What Is Order Flow Trading and Why It Matters
Order flow is an advanced way to analyze trading volume, letting you study executed trades in real time. Unlike traditional volume indicators, order flow shows how trades are formed, helping you see who made the trade, when it was opened, and in what size.
Order flow helps determine whether a trade was initiated by a buyer or a seller. By analyzing order flow at each price level, traders can identify areas of highest interest where the most transactions occurred. This level is known as the Point of Control (POC). The Value Area (VA) represents the price range where most trading activity took place during a given period (typically about 70% of total volume).
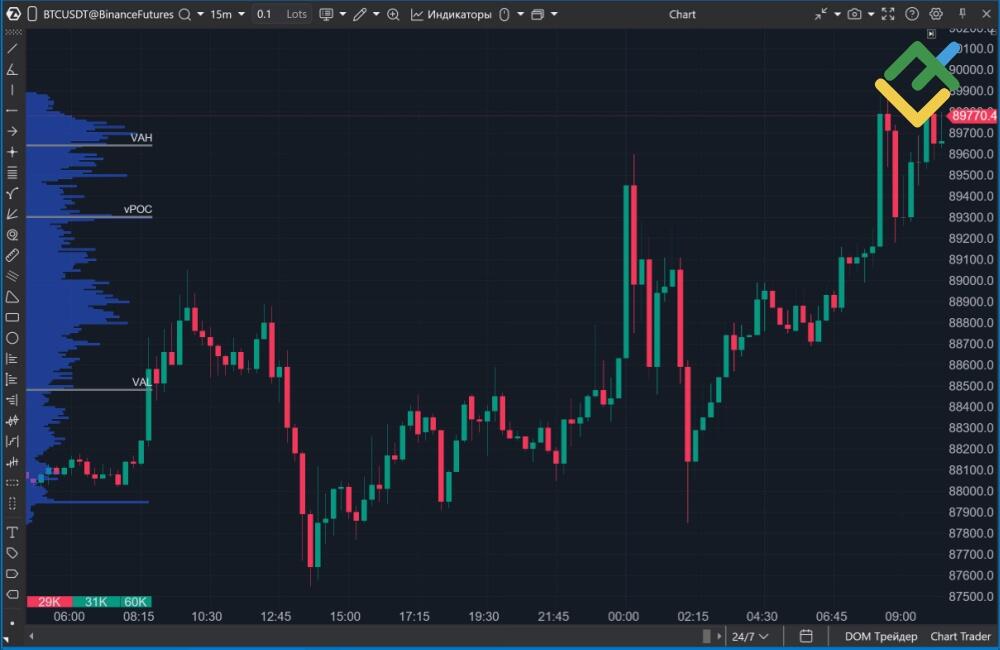
Figure 1. POC, VAL, and VAH levels on the chart
Order flow helps uncover hidden liquidity, large limit orders that are not visible in the order book but absorb market orders. Special tools such as the footprint chart and the Depth of Market (DOM) are used for this purpose. The key elements for understanding and applying this method are the different types of orders, namely limit orders and market orders.
Passive orders or limit orders are orders to buy or sell at a specified price that remain in the order book until matched, thereby adding liquidity to the market.
Aggressive orders or market orders allow traders to open positions immediately at the best available prices. These orders absorb liquidity from the order book.
The BTCUSD chart below shows a large limit sell order located at the $90,000 level, a potential resistance. Order flow trading focuses on aggressive market orders, which drive price movement. By analyzing where and how many orders are executed, traders can assess whether buyers or sellers are more active.
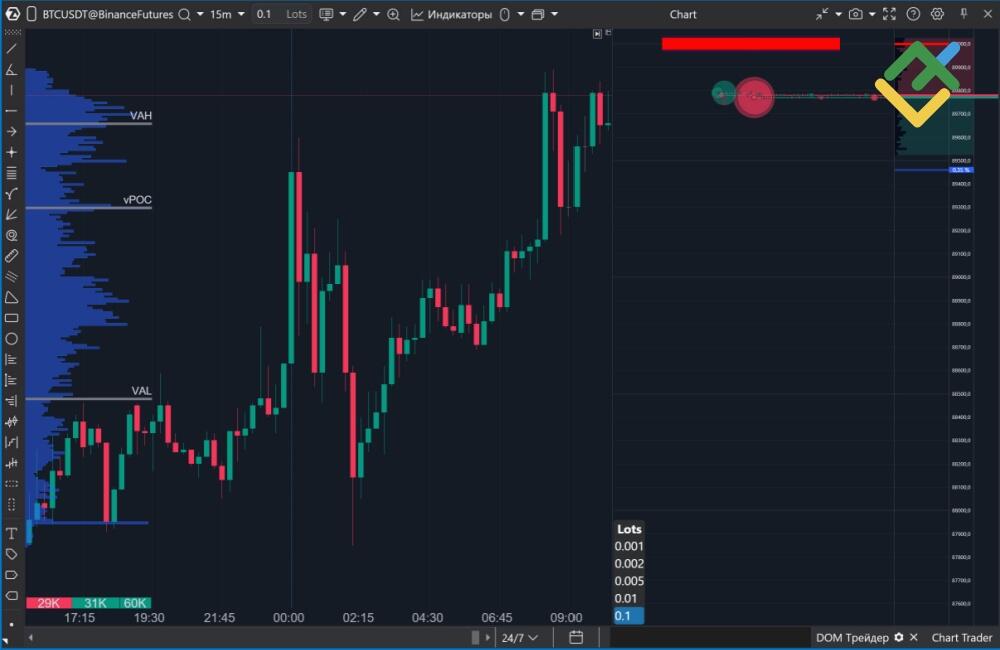
Figure 2. DOM analysis on the BTCUSDT chart
Understanding Footprint Charts: Volume Cluster Analysis
Footprint charts visualize order flow within each candlestick or bar. Unlike standard charts, they show not only the volume traded over a given period, but also how that volume is distributed across individual price levels. This makes it possible to see where major market participants are leaving their "footprints" by accumulating or exiting positions.
A key element of the analysis is identifying imbalances. Imbalances occur when buying volume at a given price level significantly exceeds selling volume at the adjacent level, or vice versa. Such imbalances reflect aggressive activity by market participants and often highlight strong areas of support or resistance. This information helps make more informed decisions in intraday trading.
Components of Footprint Charts: Bid, Ask, and Delta
Each candlestick on a footprint chart displays two numbers separated by a colon or an "x." These numbers represent the traded volume at a specific price level. The value on the left, typically shown in red or orange, indicates the volume of market sell orders. The value on the right, usually shown in blue or green, represents the volume of market buy orders.
Example: On the BTCUSD Footprint chart, the price level at $89,800 shows values of 1×9 and 4×2 on two consecutive candlesticks. This means that at this price, one market sell order and nine market buy orders were executed, indicating strong buying pressure. On the next candlestick, four market sell orders and two market buy orders were executed at the same level, showing that selling pressure increased. In other words, bulls initially controlled the market, but momentum later shifted in favor of bears.
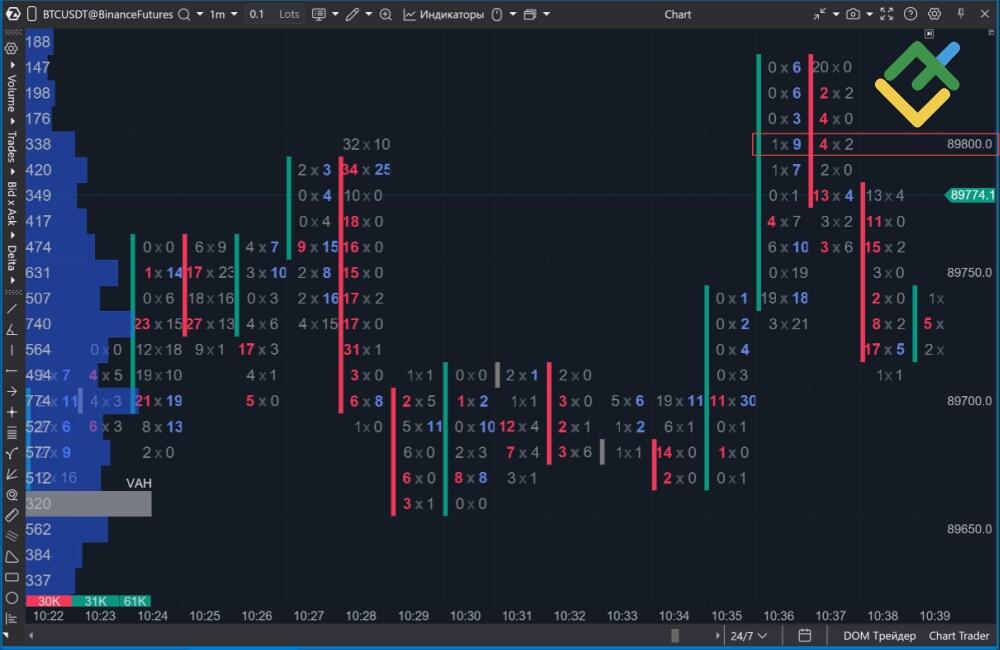
Figure 3. Market orders execution on the footprint chart
Types of Footprint Charts
Although several variations of footprint charts exist, the following are the most commonly used:
- Classic Footprint. Displays bid and ask volume at each price level within a candlestick,
- Volume Profile Footprint. Combines the footprint chart with a volume profile, which shows the distribution of traded volume across price levels over a given period. This helps identify high-volume nodes and potential support and resistance areas.
- Diagonal Footprint. Shows bid and ask volumes diagonally, allowing traders to better track the sequence and flow of order execution over time.
How to Read Footprint Chart: Decoding Market Information
Using footprint charts, traders assess volume distribution, supply and demand imbalances, and price reactions to liquidity inflows. This approach helps market participants gain a deeper insight into the structure of current movements and focus on real-time trades.
The chart below shows that after buying pressure weakened near $89,830, the price failed to gain acceptance above the Value Area High (VAH) and encountered resistance. As selling activity increased, sellers began to dominate the market. The VAH label in the lower-left corner marks the upper boundary of the Value Area, where most trading volume was concentrated. Without a strong bullish impulse and acceptance above VAH, the price is likely to move back toward the Point of Control (POC).
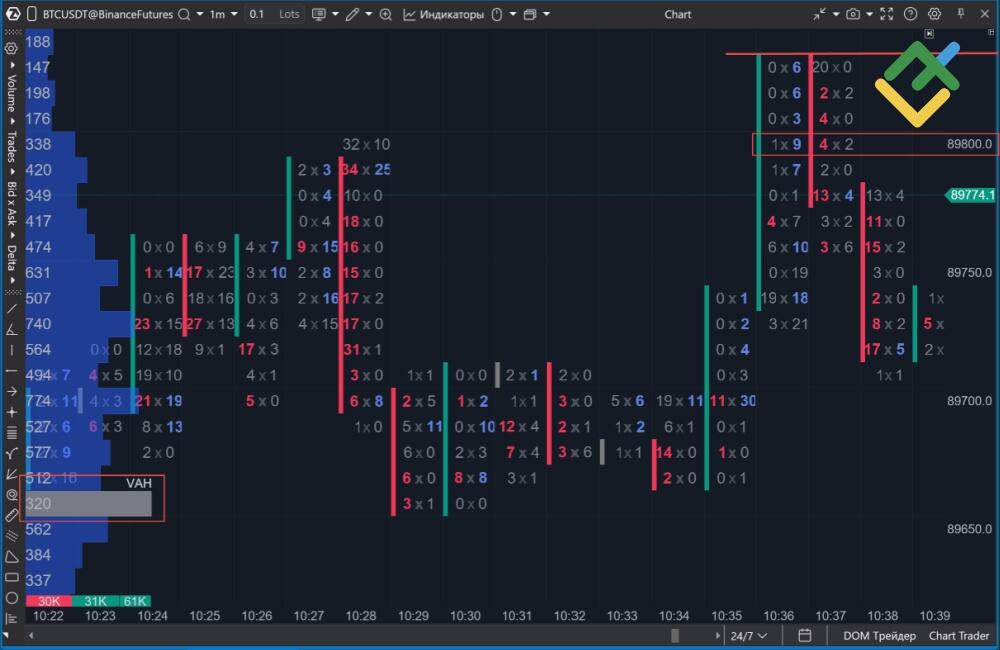
Figure 4. Buying exhaustion and price reversal on the footprint chart
Reading Volume Distribution and Delta Analysis
First, identify areas on the chart with abnormally high trading volume. These areas, known as High Volume Nodes (HVNs), represent price levels where a battle between buyers and sellers occurred. As a result, strong support and resistance zones tend to form at these levels and are likely to influence future price movement.
Delta analysis is a powerful tool for assessing market sentiment. Delta measures the net difference between aggressive buy and sell volumes over one candlestick. Conceptually, delta serves a role similar to the Accumulation/Distribution Indicator (A/D). A positive delta means buyers dominate, while a negative delta shows sellers are in control.
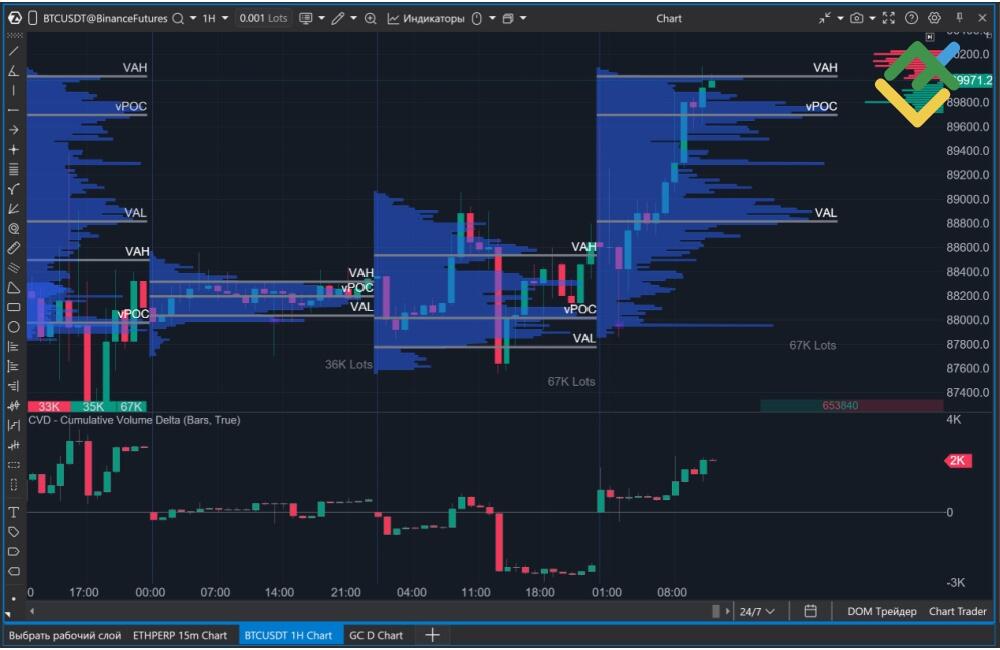
Figure 5. High-volume node (HVN) zones highlighted in blue and the cumulative volume delta (CVD) indicator
Not only does the absolute value of delta matter, but also its movement. When price continues to rise while delta decreases, this often signals weakening bullish momentum. Conversely, when price declines but delta increases, it may indicate seller exhaustion and a potential end of the downtrend. This imbalance between price and delta is known as delta divergence and is a key concept in footprint chart analysis.
Figure 5 shows that the increase in the cumulative positive CVD delta moves in line with the price advance. The price breaks above the VAH and attempts to hold above this level. However, rising delta alone does not guarantee price acceptance, especially when the move occurs near the boundaries of the value area. In such conditions, entering long positions is premature. It remains unclear whether buyers will gain control or sellers will defend the area. Traders should wait for clearer confirmation, such as a pullback toward the VAL zone, before considering long positions. Any trade decision should be confirmed by additional factors, including delta behavior, HVN, POC, and VAH levels.
Identifying Point of Control and Value Areas
Experienced traders look for specific patterns on the footprint chart in addition to analyzing the delta.
Absorption occurs when a large volume of aggressive orders enters the market, but the price fails to move. For example, as price approaches strong resistance, aggressive buy market orders appear, producing high volume and a positive delta on the footprint chart. Despite this, the level is not broken, the price stalls, and then reverses downward (Fig. 6).
This occurs because a large volume of sell limit orders is placed at the level. These orders, often partially hidden, absorb aggressive buying and stop the price from climbing.
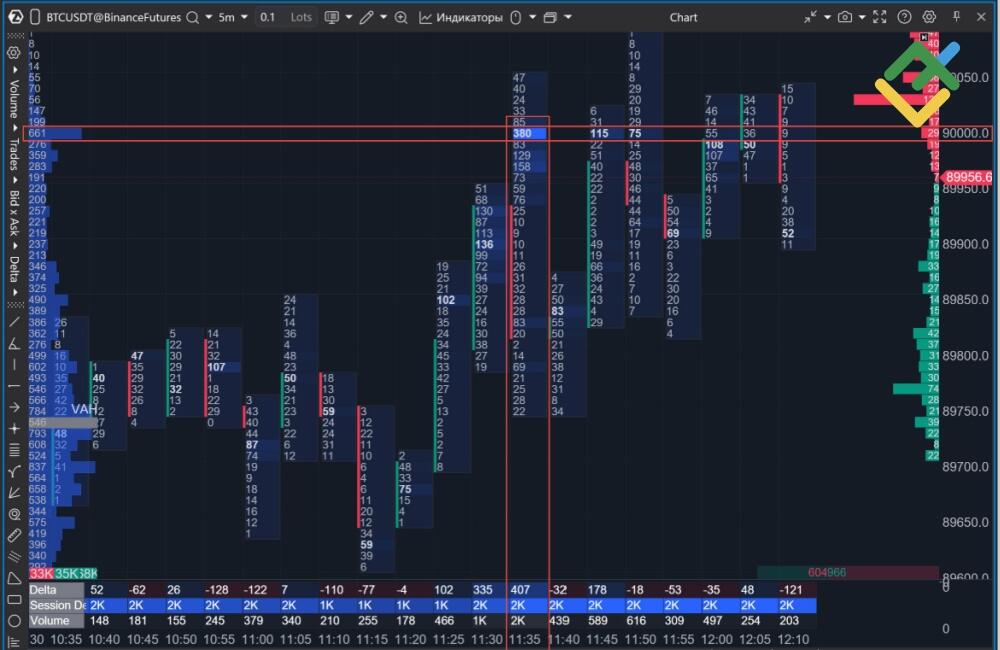
Figure 6. Aggressive buying absorbed at the $90,000 level
When a large traded volume fails to produce further price movement, it is a clear sign that the current trend is losing strength. Such absorption often precedes a downward price reversal.
Initiation is the complete opposite of absorption. Major traders act aggressively and decisively. As the price approaches the resistance level, it breaks through and settles above it. At the same time, the footprint chart shows a sharp increase in delta.
This behavior indicates that a major market participant is not waiting for a pullback but is instead entering positions aggressively in the direction of the trend using market orders. As a result, existing sell limit orders at the resistance level are absorbed. The strong and rapid price movement, supported by a sharp increase in delta, reflects clear buyer dominance. This confirms that the breakout is intentional rather than random, and the price will likely keep growing.
Untraded levels represent price levels with zero or extremely low trading volume. On a footprint chart, they are visible as empty price levels. Due to the lack of significant limit orders, these zones offer little resistance, allowing the price to pierce them rapidly.
When price enters such a zone, market participants typically expect it to move quickly toward the next key level where volume is concentrated. Traders often use these "gaps" to define take-profit levels. However, these zones are not suitable for placing stop-loss orders.
The chart below shows how the price consolidated in the $85,800–$85,600 range. Eventually, bulls managed to hold the asset above this zone, and it swiftly returned to the $89,600 level despite a significant negative delta.
Tip: If you are unsure whether the price will break through a key level or reverse, use other technical analysis tools, such as RSI or ADX indicators.
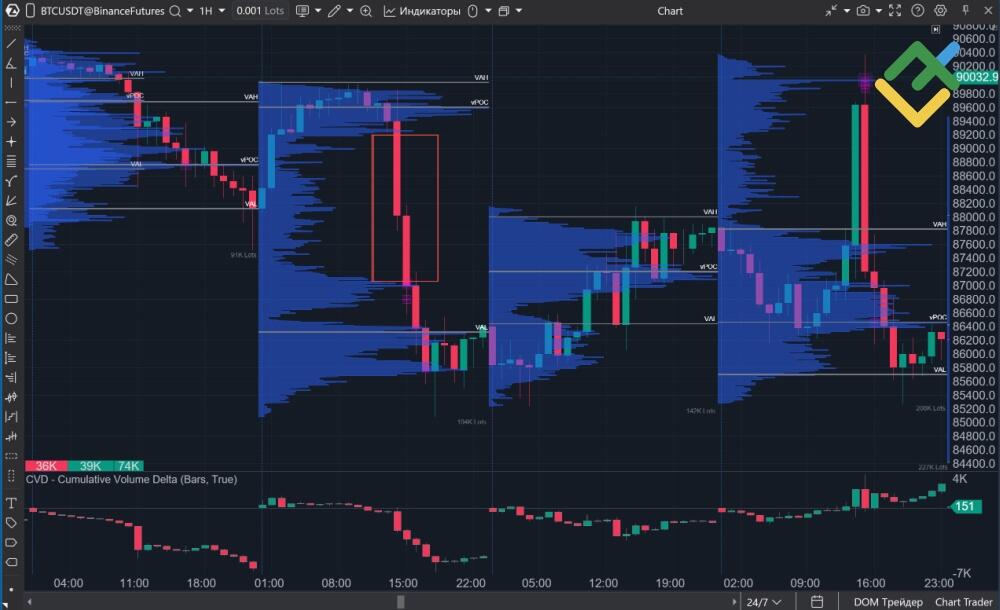
Figure 7. Trading using untraded levels
Key Order Flow Trading Patterns in Footprint Charts
Order flow analysis and footprint charts help identify unique patterns that are often invisible on standard charts. Thus, you can determine entry and exit points more precisely.
- A market imbalance occurs when, at a specific price level, the volume of aggressive orders on one side significantly exceeds that on the other. For example, there may be 50 market buy orders versus only 5 market sell orders. Such significant imbalances often indicate the presence of a large market participant. Trading based on imbalances is a widely used order-flow strategy.
- Stacked imbalances form when several strong imbalances appear consecutively at adjacent price levels in the same direction. This structure reflects sustained aggressive participation and often creates strong momentum, increasing the likelihood of trend continuation. Stacked imbalances are commonly observed during strong movements.
- Delta divergence is one of the strongest early warning signals in footprint analysis. It occurs when price sets a new high (or low), while delta moves in the opposite direction, failing to confirm the price extreme. This may indicate weakening buying or selling pressure and signal a potential reversal. However, the delta divergence signal should be confirmed by additional technical indicators.
Order Flow Trading Strategies Using Footprint Charts
The order flow method is the basis for many effective trading strategies. Essentially, it is an advanced scalping indicator that helps traders interpret market behavior based on the activity of major players rather than guessing.
Scalping and Day Trading Techniques
The Volume Profile, including the Value Area (VA) and Point of Control (POC), helps define the market's perceived fair value for the current session and trading range. The footprint chart, in turn, reveals the specific activity of major market participants. Together, these tools can be effectively used for scalping.
Option 1: Initiation and breakout of a key level
This setup is strongest when price breaks out above the Value Area, specifically near the VAH or the POC. A breakout here suggests that buyers are overcoming sellers, and a new upward move may be starting. On a footprint chart, this is confirmed by stacked buying imbalances at successive price levels and a sharp rise in delta, showing aggressive bullish pressure. These signals indicate that demand is stronger than supply and momentum is building to the upside.
What scalpers do:
- Open a long trade when the first or second market imbalance appears at the breached VAH or POC level.
- Set a stop-loss order just below the breached zone.
- The goal is to capture the impulse quickly. The first take-profit order is set at the next key level. You can also lock in profits after the impulse ends, when the imbalance disappears.
The main disadvantage of this method is that the price will return to the previous range when stop orders placed below the VAH level are triggered.
Option 2: Absorption and false breakout
This setup emerges when the market attempts to exit the Value Area but encounters strong support. The price approaches the VAL level and may either decline or return to the VAH. These levels define the boundaries of the accepted price range, where the market is in balance and reversals are more likely.
The price breaks below the VAL, but the footprint chart shows strong absorption at this level. A large number of market sell orders hit the bid, causing the delta to turn negative, yet the price fails to move lower. This indicates the presence of a large passive buyer absorbing selling pressure. As selling weakens, the delta begins to stabilize and then turn positive, even while the price remains near the lows. Once absorption is complete, the price moves back above the VAL and often accelerates toward the POC and VAH.
The opposite scenario occurs during a false breakout above the VAH. The price breaks above the VAH, but the footprint chart reveals selling absorption.
What scalpers do:
- Open a short trade at the VAH or a long trade at the VAL as soon as it becomes clear that the price cannot break through the key level and begins to return to the Value Area.
- Place a stop-loss order just above the false breakout high, above the VAH, or just below the VAL.
- This setup aims to trade a price reversal. Once the reversal starts, the market often moves toward the opposite side of the range or back to the POC, the main balance area.
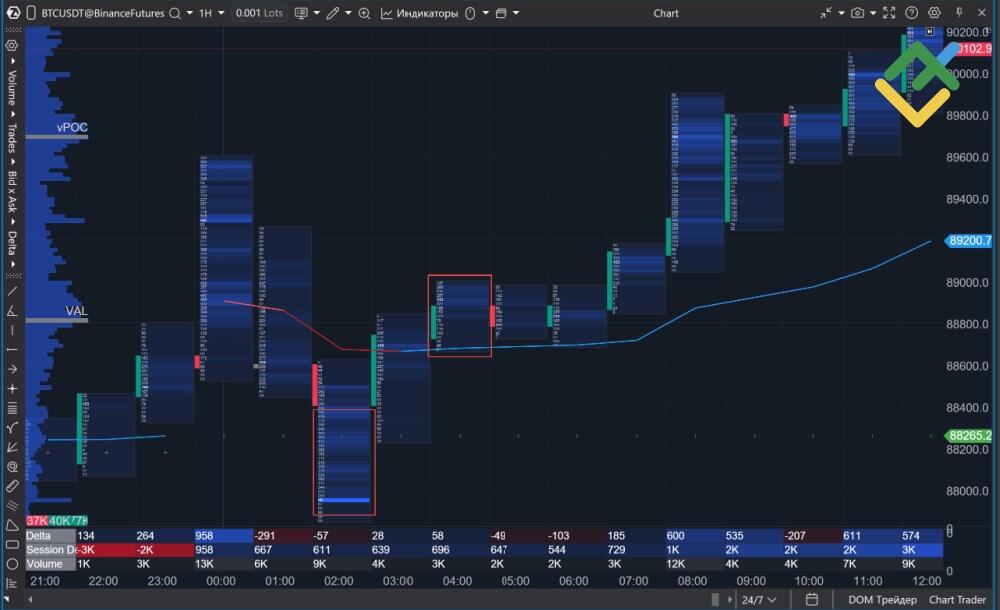
Figure 8. Absorption and false breakout near the VAL
Breakout Confirmation and Reversal Strategies
When trading breakouts, market participants look for order-flow confirmation. In a bullish scenario, the price holds above a key resistance level while the footprint chart shows a strong rise in positive delta and the absorption of all passive sell orders. In a bearish scenario, the price holds below a key support level. At the same time, the footprint chart shows a sharp increase in negative delta and buying pressure being absorbed by aggressive sellers, indicating that supply dominates and the breakout is likely valid.
In the case of reversals, traders look for delta divergence or a decline in volume at key levels. The RSI and ADX indicators can provide additional confirmation.
Delta Divergence and Stacked Imbalances
This strategy is based on identifying divergences between price and delta. If the price rises while delta declines, it may signal a potential short entry. Conversely, if the price falls and the negative delta moves toward zero, it may indicate an opportunity to open a long position. This method enables traders to enter at an early stage of a potential reversal. However, it can lead to losses if additional factors, such as DOM depth and market imbalance, are not taken into account.
Important: VAH and VAL — Decision-Making Levels
VAH and VAL levels are not classic support and resistance levels. Their role is determined solely by market reaction.
If, after a breakout of the VAH or VAL, the price fails to hold above or below these levels (depending on the trend) and resting limit orders absorb the order flow, the market does not accept the new price. In such cases, the VAH and VAL serve as pivot points. Conversely, when a move beyond the value area is supported by a series of market imbalances, rising delta, and price acceptance outside the Value Area, the breakout is confirmed. Therefore, the VAH and VAL should be viewed not as static levels, but as zones for testing market consensus.
Platforms for Order Flow Analysis and Footprint Trading
The main limitation of using footprint charts is that most trading platforms do not support this method, and a standard trading terminal is not sufficient for effective order flow analysis. Traders need to install specialized software that can process and visualize volume data in real time.
Platforms like ATAS, Volfix, and Jigsaw Trading, along with custom indicators for NinjaTrader and Sierra Chart, give traders access to footprint charts and advanced tools, including those for delta analysis. Their direct connection to exchange order flow lets you monitor trades with minimal delay, which is crucial for intraday strategies where speed drives profits.

Conclusion
Order flow and footprint charts are powerful analytical tools that simplify intraday trading. Unlike traditional charts and technical analysis, order flow gives traders insight into real market transactions, allowing them to observe not only the outcome of the battle between buyers and sellers but also the process itself in detail.
Footprint charts and delta analysis let traders read the market from within. This means tracking big players, gauging trend strength, and spotting entry points. While these tools require specialized software and time to master, their ability to reveal market movement makes them indispensable for advanced traders.