
Tesla (TSLA) Stock Forecast for 2026, 2027, 2028–2030 and Beyond
Tesla (TSLA) Stock Forecast for 2026, 2027, 2028–2030 and Beyond
Tesla stands out in the market due to its innovations in electric vehicles, solar power, and artificial intelligence. Yet,This article explores various scenarios and factors that may impact Tesla's future
testng working flow
The article covers the following subjects:
- Major Takeaways
- TSLA Real-Time Market Status
- TSLA Stock Price Forecast for 2025–2026 Based on Technical Analysis
- Analysts' TSLA Share Price Projections for 2027
- Analysts' TSLA Share Price Projections for 2028
- Analysts' TSLA Share Price Projections for 2029
- Analysts' TSLA Share Price Projections for 2030
- Analysts' TSLA Share Price Projections until 2050
- Market Sentiment for TSLA (Tesla) on Social Media
- TSLA Price History
- TSLA Shares Fundamental Analysis
- More Facts About TSLA
- Advantages and Disadvantages of Investing in TSLA
- How We Make Forecasts
- Conclusion: Is TSLA a Good Investment?
- TSLA Price Prediction FAQ
Major Takeaways
- The current TSLA stock price is $433.15 as of 07.01.2026.
- Tesla reached its all-time high of $498.46 on 22.12.2025. The all-time low of $0.99 was set on 07.07.2010.
- At the end of 2025, TSLA shares are forecast to trade in a wide range of $440.00–$530.00 since market participants have mixed expectations.
- Estimates for 2026 also diverge. Conservative forecasts suggest the asset will trade between $441.00 and $519.00, while more optimistic platforms anticipate a rally to $1,200.00 or higher.
- Most forecasts for 2027–2029 predict a gradual strengthening of Tesla shares. Moderate scenarios estimate the stock will fluctuate between $500.00 and $800.00, while optimistic predictions indicate a price range of $1,100.00–$2,000.00.
- Long-term estimates for 2040–2050 are predominantly upbeat. Forecasting platforms suggest Tesla's share price will advance to $4,600.00–$5,900.00, provided current fundamental conditions remain unchanged.
TSLA Real-Time Market Status
The TSLA price is trading at $433.15 as of 07.01.2026.
#TSLA current rate in the Forex market:
#TSLA = $433.32
Sell
433.15
Buy
433.32
Sentiment
100%
1-day change
-0.7 (-3.04%)
To determine the current state of Tesla Inc. shares, remember to track the company's financial indicators:
- Market capitalization is a measure of a company's net value as perceived by investors.
- The number of shares outstanding signifies the total number of shares available in the market.
- Earnings per share (EPS) represent the amount of a company's earnings available to each share, revealing its profitability.
- The price-to-earnings ratio (P/E) indicates how high the stock price is in relation to the earnings.
- Monthly volatility illustrates 30-day fluctuations in the asset price.
- The average trading volume over 20 days shows the average daily volume over the last 20 trading sessions.
| Indicator | Value |
| Market cap | $1.53 trillion |
| Shares outstanding | 3.22 billion |
| Earnings per share (EPS) | $1.45–$1.64 (TTM) |
| Price-to-earnings ratio (P/E) | 300+ (TTM) |
| 52-week range | $288–$481 |
| Average trading volume over 3 months | 80–90 million shares per day |
TSLA Stock Price Forecast for 2025–2026 Based on Technical Analysis
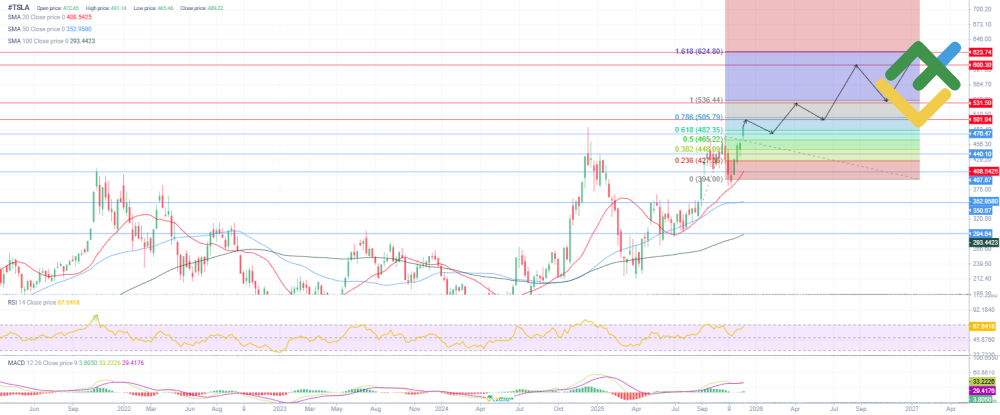
TSLA is trading in a strong bullish trend. Previously, the stock price reversed upward after reaching the 280–300 zone, formed higher lows, and settled above the 408–430 zone. As a result, this zone turned from resistance into a support level.
The price is now hovering above the SMA50 and SMA100, confirming the strength of the medium-term uptrend. The support level is at 476–482. However, the price may decline even lower to 448. Resistance levels are at 502 and 531. The Fibonacci levels of 1.272 and 1.618, corresponding to the 600 and 624 marks, define the next resistance levels. The RSI is in the overbought zone, showing no divergence. The MACD indicator is in the positive zone, confirming the current momentum.
The price is forming an impulse and is likely experiencing an accumulation phase. Therefore, the TSLA stock is expected to continue rising.
The table below presents TSLA's stock price forecasts for the next 12 months.
| Month | Minimum, $ | Maximum, $ |
| January 2026 | 450 | 515 |
| February 2026 | 460 | 535 |
| March 2026 | 470 | 520 |
| April 2026 | 475 | 560 |
| May 2026 | 495 | 585 |
| June 2026 | 505 | 610 |
| July 2026 | 525 | 625 |
| August 2026 | 540 | 600 |
| September 2026 | 530 | 630 |
| October 2026 | 555 | 645 |
| November 2026 | 575 | 660 |
| December 2026 | 600 | 680 |
Long-Term Trading Plan for TSLAUSD for 2026
According to the technical analysis conducted, TSLA will remain bullish until December 2026, as the price remains above key moving averages and trades in a stable uptrend. The base scenario assumes the asset will go up to 600 and 624. These levels can serve as profit targets.
The trading strategy suggests opening long trades when the price dips to the 480–465 zone, provided that bullish pressure persists. Moreover, long trades can be opened if the asset settles above 502, as this will mean the market is poised to rise further. A stop-loss order can be placed below 448. Consider locking in part of the profits near 531 and 600. Once these zones are reached, one may use a trailing stop to secure the trades.
Analysts' TSLA Share Price Projections for 2026
The forecasts for the TSLA price movement in 2026 indicate a wide range of potential price scenarios. Some predict a moderate increase, while others anticipate significant volatility and corrections. The spread of estimates reflects market uncertainty and different approaches used by forecasting platforms.
StockScan
Price range: $793.400–$1,221.000.
StockScan suggests the stock will increase steadily throughout 2026. The asset is expected to reach a low early in the year and soar to a high by year-end. The average values are predicted to rise progressively.
| Month | Minimum, $ | Average, $ | Maximum, $ |
| January | 793.400 | 875.000 | 879.400 |
| February | 870.400 | 934.400 | 934.400 |
| March | 913.200 | 1,001.000 | 1,015.000 |
| April | 997.100 | 1,015.000 | 1,041.000 |
| May | 945.600 | 995.500 | 1,016.000 |
| June | 982.900 | 1,026.000 | 1,036.000 |
| July | 1,015.000 | 1,025.000 | 1,067.000 |
| August | 1,017.000 | 1,055.000 | 1,059.000 |
| September | 1,055.000 | 1,099.000 | 1,108.000 |
| October | 1,099.000 | 1,136.000 | 1,146.000 |
| November | 1,131.000 | 1,171.000 | 1,173.000 |
| December | 1,173.000 | 1,213.000 | 1,221.000 |
LongForecast
Price range: $441.062–$518.534.
LongForecast anticipates relatively smooth price movement in 2026. A correction may start at the beginning of the year. After that, the asset is expected to advance, reaching a swing high by year-end. Volatility is projected to be low.
| Month | Minimum, $ | Min–Max, $ | Maximum, $ |
| January | 456.820 | 456.820–461.049 | 461.049 |
| February | 449.444 | 449.444–460.418 | 460.418 |
| March | 441.062 | 441.062–451.993 | 451.993 |
| April | 449.874 | 449.874–453.043 | 453.043 |
| May | 450.597 | 450.597–455.713 | 455.713 |
| June | 457.910 | 457.910–468.581 | 468.581 |
| July | 469.632 | 469.632–477.807 | 477.807 |
| August | 477.586 | 477.586–484.867 | 484.867 |
| September | 484.765 | 484.765–499.060 | 499.060 |
| October | 493.476 | 493.476–501.302 | 501.302 |
| November | 504.043 | 504.043–514.328 | 514.328 |
| December | 514.189 | 514.189–518.534 | 518.534 |
CoinCodex
Price range: $159.420–$561.540.
According to CoinCodex, the TSLA price will be unstable in 2026 and may decline notably in the second half of the year, reaching a low in December. Volatility is expected to be elevated.
| Month | Minimum, $ | Average, $ | Maximum, $ |
| January | 400.580 | 486.150 | 561.540 |
| February | 368.000 | 422.740 | 450.140 |
| March | 375.480 | 442.800 | 532.420 |
| April | 417.080 | 483.840 | 541.110 |
| May | 308.230 | 366.650 | 444.330 |
| June | 312.060 | 338.040 | 368.050 |
| July | 325.410 | 369.750 | 438.590 |
| August | 396.070 | 427.620 | 447.670 |
| September | 384.320 | 418.890 | 449.080 |
| October | 298.740 | 323.520 | 367.940 |
| November | 242.920 | 275.330 | 331.010 |
| December | 159.420 | 221.400 | 280.290 |
Analysts' TSLA Share Price Projections for 2027
Forecasts for 2027 remain highly uncertain. Some forecasting platforms predict rapid growth, while others anticipate heightened volatility. The range of projections reflects differing expectations regarding business expansion and market conditions.
Note: The price ranges below reflect the expected volatility of the asset over a year. The minimum and maximum prices may not be displayed in the tables.
StockScan
Price range: $1,215.000–$1,561.000.
According to StockScan, the uptrend will continue in 2027. Average values are expected to remain significantly above the previous year's levels. The asset is projected to reach a high in the second half of the year, indicating a predominantly bullish scenario.
| Quarter | Minimum, $ | Average, $ | Maximum, $ |
| Q1 | 1,215.000 | 1,333.667 | 1,404.000 |
| Q2 | 1,326.000 | 1,389.333 | 1,449.000 |
| Q3 | 1,367.000 | 1,467.667 | 1,523.000 |
| Q4 | 1,410.000 | 1,482.000 | 1,561.000 |
LongForecast
Price range: $501.130–$578.323.
LongForecast predicts the Tesla stock price will advance steadily in 2027. The asset is expected to be less volatile and may progressively exceed swing highs.
| Quarter | Minimum, $ | Average, $ | Maximum, $ |
| Q1 | 501.130 | 513.411 | 521.309 |
| Q2 | 509.999 | 519.102 | 529.002 |
| Q3 | 529.169 | 546.392 | 559.449 |
| Q4 | 553.433 | 570.862 | 578.323 |
CoinCodex
Price range: $152.570–$423.870.
According to CoinCodex, the stock price will experience volatility in 2027. The asset is expected to trade near the lowest levels in the first half of the year and recover in the second half.
| Quarter | Minimum, $ | Average, $ | Maximum, $ |
| Q1 | 152.570 | 251.040 | 303.600 |
| Q2 | 223.840 | 289.500 | 405.070 |
| Q3 | 312.190 | 370.940 | 423.870 |
| Q4 | 286.080 | 343.320 | 383.590 |
Analysts' TSLA Share Price Projections for 2028
Forecasts for 2028 differ significantly. Some experts anticipate long-term growth, while others point to possible corrections. The estimates are mixed due to potential changes in market conditions and macroeconomic factors.
StockScan
Price range: $1,492.000–$1,822.000.
StockScan's TSLA price forecast for 2028 suggests the bullish trend will persist. Average values are expected to increase throughout the year, with the price reaching a high in the second half of the year.
| Quarter | Minimum, $ | Average, $ | Maximum, $ |
| Q1 | 1,514.000 | 1,555.000 | 1,607.000 |
| Q2 | 1,500.000 | 1,523.333 | 1,570.000 |
| Q3 | 1,542.000 | 1,636.667 | 1,679.000 |
| Q4 | 1,646.000 | 1,741.333 | 1,822.000 |
LongForecast
Price range: $561.387–$638.139.
According to LongForecast, Tesla shares will grow moderately in 2028. Quarterly price ranges are likely to remain relatively narrow. No dramatic price jumps are expected.
| Quarter | Minimum, $ | Average, $ | Maximum, $ |
| Q1 | 561.387 | 572.973 | 581.487 |
| Q2 | 570.163 | 578.141 | 588.701 |
| Q3 | 591.827 | 606.919 | 619.750 |
| Q4 | 613.516 | 631.731 | 638.139 |
CoinCodex
Price range: $204.400–$682.810.
According to CoinCodex, TSLA will be highly volatile in 2028. The price is unlikely to rise above $348.530 in the first half of the year but may recover in the second half and set a new swing high of $682.810.
| Quarter | Minimum, $ | Average, $ | Maximum, $ |
| Q1 | 232.750 | 277.230 | 346.760 |
| Q2 | 204.400 | 255.810 | 348.530 |
| Q3 | 282.710 | 330.803 | 379.310 |
| Q4 | 310.760 | 472.307 | 682.810 |
Analysts' TSLA Share Price Projections for 2029
Most forecasts for TSLA's share price indicate that 2029 will be a transitional period marked by high uncertainty. Forecasting platforms take into account both historical price movement and the risks of sharp price fluctuations.
StockScan
Price range: $343.800–$2,036.000.
According to StockScan, Tesla shares will grow throughout most of 2029. At the same time, the platform allows for extremely high values by the end of the year, as the forecast's strong sensitivity to market changes broadens the range of possible scenarios.
| Quarter | Minimum, $ | Average, $ | Maximum, $ |
| Q1 | 1,809.000 | 1,862.667 | 1,904.000 |
| Q2 | 1,857.000 | 1,910.000 | 1,947.000 |
| Q3 | 1,926.000 | 1,958.667 | 1,988.000 |
| Q4 | 343.800 | 1,430.333 | 2,036.000 |
LongForecast
Price range: $621.839–$699.660.
LongForecast anticipates the stock price will continue its moderate uptrend in 2029. Quarterly ranges are predicted to remain relatively tight. The price is expected to climb steadily, without any sharp swings.
| Quarter | Minimum, $ | Average, $ | Maximum, $ |
| Q1 | 621.839 | 633.235 | 641.585 |
| Q2 | 630.369 | 639.303 | 648.082 |
| Q3 | 651.177 | 666.843 | 679.922 |
| Q4 | 673.724 | 692.373 | 699.660 |
CoinCodex
Price range: $328.030–$795.850.
CoinCodex predicts the Tesla stock price will be highly volatile in 2029. In the first half of the year, phases of corrections may occur. In the second half, the price range is expected to expand, and the asset may hit higher levels.
| Quarter | Minimum, $ | Average, $ | Maximum, $ |
| Q1 | 328.030 | 478.057 | 623.640 |
| Q2 | 330.250 | 439.867 | 524.520 |
| Q3 | 429.490 | 512.170 | 659.610 |
| Q4 | 579.060 | 650.380 | 795.850 |
Analysts' TSLA Share Price Projections for 2030
Predictions for 2030 are divided. Forecasting platforms suggest the stock price may either continue to climb or experience increased volatility during the year.
StockScan
Price range: $353.400–$958.400.
According to StockScan, the stock will start 2030 at the yearly low and then gradually appreciate, reaching a high by year-end.
| Quarter | Minimum, $ | Average, $ | Maximum, $ |
| Q1 | 353.400 | 446.633 | 493.300 |
| Q2 | 503.600 | 593.700 | 648.000 |
| Q3 | 658.200 | 756.200 | 808.300 |
| Q4 | 819.300 | 918.767 | 958.400 |
LongForecast
Price range: $682.292–$756.338.
LongForecast suggests the TSLA price will extend its uptrend in 2030. Quarterly ranges are likely to stay relatively narrow, and the asset is expected to rise progressively.
| Quarter | Minimum, $ | Average, $ | Maximum, $ |
| Q1 | 682.292 | 693.001 | 701.697 |
| Q2 | 690.622 | 698.178 | 707.494 |
| Q3 | 710.530 | 727.194 | 739.996 |
| Q4 | 734.052 | 750.342 | 756.338 |
CoinCodex
Price range: $235.620–$813.850.
According to CoinCodex, the TSLA stock will face significant volatility in 2030. The asset is expected to reach a high in the first half of the year and expand its trading range in the second half.
| Quarter | Minimum, $ | Average, $ | Maximum, $ |
| Q1 | 538.540 | 656.323 | 813.850 |
| Q2 | 452.630 | 572.620 | 648.230 |
| Q3 | 487.930 | 593.474 | 655.060 |
| Q4 | 235.620 | 396.120 | 522.120 |
Analysts' TSLA Share Price Projections until 2050
Long-term price forecasts for TSLA's performance from 2031 to 2050 are based on the company's financial indicators, its profit history, and the sustainability of its business model. Forecasting platforms factor in the potential growth of key business areas, as well as the long-term impact of macroeconomic and market factors.
According to StockScan, Tesla shares will appreciate in the long term. Forecasts for the period up to 2050 indicate potential growth, assuming that current fundamentals and stable market conditions persist.
| Year | Minimum, $ | Average, $ | Maximum, $ |
| 2035 | 3,522 | 3,612 | 3,621 |
| 2040 | 4,609 | 4,645 | 4,653 |
| 2050 | 5,762 | 5,878 | 5,879 |
Market Sentiment for TSLA (Tesla) on Social Media
Media sentiment is a crucial leading indicator, shaping investor expectations, boosting investments, and potentially influencing demand, volatility, and stock revaluation in the short term.
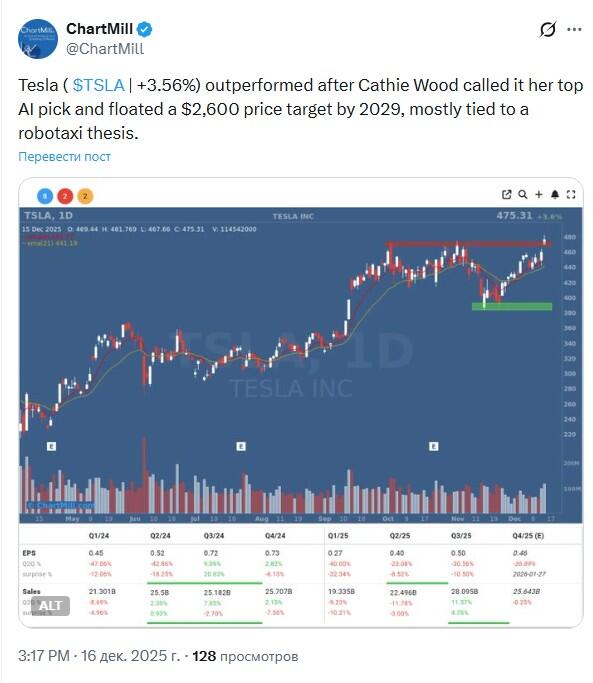
For example, user @ChartMill posts on X (formerly Twitter) that Tesla surged after Cathie Wood's positive comments regarding the asset. She believes that AI and robotaxis will be key drivers, pushing the stock up to $2,600 by 2029.

User @Teslanomy_com notes that Mizuho Bank raises its target price for Tesla to $530, indicating growing confidence among major institutional analysts in the robotaxi business.
The analysis of posts on X suggests a positive overall media background, boosting market multiples and fostering optimism. The news flow is bolstering capital inflows, creating short-term price spikes.
TSLA Price History
Tesla (TSLA) reached the highest price of $498.46 on 22.12.2025.
The lowest price of Tesla (TSLA) was recorded on 07.07.2010 when the stock declined to $0.99.
Loading...
It is essential to evaluate historical data to ensure our forecasts are as accurate as possible. Below is a chart of TSLA's performance over the last ten years.
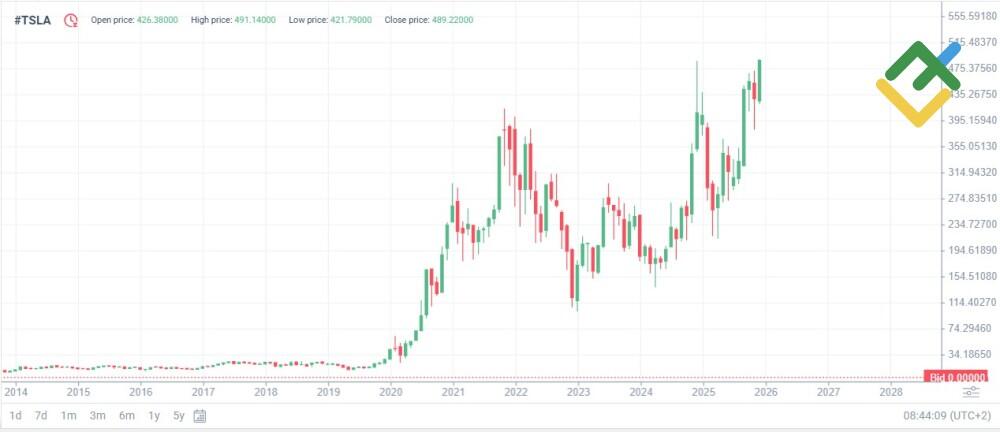
- In 2020, Tesla shares soared due to growing demand for electric vehicles.
- In 2021, the upward trend continued, with shares reaching a high thanks to their inclusion in the S&P 500 index and solid financial results.
- In 2022, the price declined due to concerns about the global economy, supply chain issues, and competition.
- In 2023–2024, Tesla shares traded in a wide range, reflecting a balance between innovation and macroeconomic risks.
- Since January 2025, TSLA's share price has shown considerable volatility, influenced by news about deliveries, developments involving Elon Musk, and broader macroeconomic factors. The price climbed to $367.60 in the spring but fell to $288.74 in July amid component supply disruptions. In mid-summer, the momentum stabilized, and the asset reached higher levels in the autumn. At the end of 2025, TSLA shares soared to $489.36 amid news of robotaxi testing.
TSLA Shares Fundamental Analysis
Like other financial instruments, TSLA's stock price is influenced by numerous macroeconomic and geopolitical factors.
- Financial performance. Strong earnings reports bolster confidence among major market players in Tesla Inc.'s long-term growth prospects. Consistently rising profits suggest high demand for the company's products, attracting new investors.
- High competition in the electric car industry. Chinese automakers' rapid growth is putting pressure on Tesla in the global market, as prices for cars from China are nearly half of Tesla's.
- Innovative technologies. On the one hand, large investments in technologies, including AI, make investors wary. On the other hand, they highlight the company's large-scale development prospects.
- Geopolitical factors. Various armed conflicts force investors to hedge their risks with precious metals and other safe-haven assets. This reduces the popularity of stocks, including TSLA, and the asset's value may decline.
- Macroeconomic factors. The trade war between the US and China significantly impacts the stock market. Sanctions and higher trade tariffs to protect domestic markets directly affect electric vehicle production and Tesla's stock price.
- Elon Musk's statements. TSLA's high volatility is partly due to the activity of Tesla Inc.'s founder on various social media platforms, particularly X. The entrepreneur’s high-profile statements have repeatedly caused major fluctuations in TSLA’s price.
More Facts About TSLA
Tesla Inc. was founded in 2003 and is headquartered in Austin, Texas. In addition to producing, repairing, and servicing vehicles, the company designs and installs solar energy generation and storage devices.
Tesla Inc. gained popularity thanks to its innovative approach to automotive engineering. Autonomous driving, robotaxis, and other AI-based technologies are how the company imagines the industry's future.
However, due to the high cost of these innovations, the company's stock remains quite volatile, attracting numerous traders. TSLA shares offer opportunities for profit in both the short and long term.
Year over year, the company's revenues and capitalization continue to grow. Tesla remains dynamic, developing in a highly competitive environment, making it popular among market participants.
Advantages and Disadvantages of Investing in TSLA
This section examines the advantages and disadvantages of investing in the TSLA stock.
Advantages
- Attractive purchase price. The asset's current price is significantly lower than the peak values of 2021, when the price reached 414.33. Certainly, there are no guarantees that the stock price will exceed those peak levels. However, expert forecasts, supported by technical analysis, inspire optimism. Large players buy and build up assets during temporary drawdowns to profit from future growth.
- Historical performance of TSLA stock prices. Positive financial earnings reports indicate increasing demand for the company's products and its steady development. The company's market capitalization is also growing, showing Tesla's substantial potential.
- The company's investments in innovative technology development. Tesla was the first to make a breakthrough in the automotive industry by creating an electric vehicle. Now, the company plans to produce autonomous vehicles and robotaxis. Additionally, the global shift to green energy will support TSLA's growth.
Disadvantages
- High production costs for electric vehicles greatly boost Tesla's vehicle prices. Tax benefits for electric cars are not particularly helpful, so consumers still face high costs. This, in turn, may negatively impact the company's revenue, profit, and stock value.
- The company's costly innovations may also harm Tesla's stock. Increasingly, Chinese companies are entering the market with more affordable electric cars, already challenging Tesla's position. Large expenditures on innovation may not pay off, potentially leading to worsening financial results for Tesla and, consequently, affecting the company's stock price.
- High volatility enables traders and investors to achieve quick profits, but it also carries a high risk of losing investments. Therefore, before making trading decisions on TSLA stock, it’s essential to conduct a thorough fundamental and technical analysis.
How We Make Forecasts
The key components in forecasting various trading instruments, including the TSLA stock, are:
1. Fundamental analysis involving:
- evaluating forecasts from leading analysis agencies;
- assessing the company's financial condition (market capitalization, income/expenses, earnings per share, business profitability, return on investment, and much more);
- analyzing the news environment around the company;
- examining geopolitical and macroeconomic factors that may affect the company's stock price.
2. Technical analysis. A more successful conservative research model combines candlestick, chart, and indicator analysis. Signals from various technical tools help identify the most advantageous entry points and determine optimal profit targets.
Conclusion: Is TSLA a Good Investment?
Tesla shares can be appealing to investors focused on long-term growth and prepared to deal with increased volatility. The company maintains a strong position in the electric vehicle sector and continues to develop key business areas. At the same time, forecasts point to a wide range of scenarios due to changing market conditions.
Investors should consider potential risks and the impact of macroeconomic factors on the price. Therefore, it is advisable to study expert analyses when making investment decisions and to balance expected returns with the investment horizon.