Fundamental vs Technical Analysis Tools: Which Should You Use?
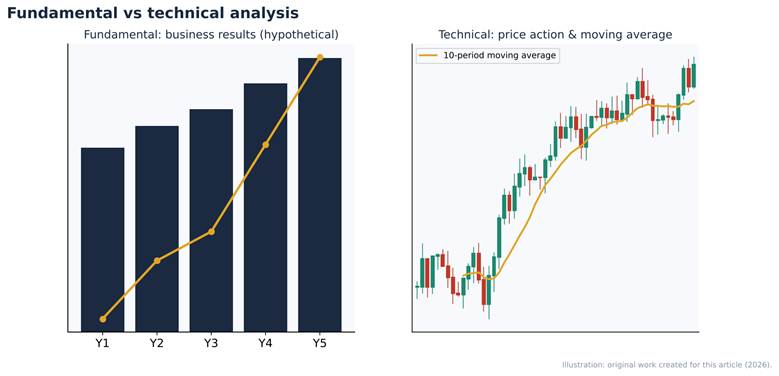
Figure: Side-by-side charts contrasting fundamental business results with technical price action and a moving average. Original illustration created for this article.
Fundamental vs Technical Analysis Tools: Which Should You Use?
Short answer: Fundamental analysis tools help you decide what a business is worth, using financial statements, valuation ratios and industry data. Technical analysis tools help you decide when to buy or sell, using price charts, volume and indicators. Long-term investors rely mostly on fundamental tools, short-term traders mostly on technical tools, and many investors combine the two: fundamentals to pick the stock, technicals to time the entry and manage risk.
The Core Difference
| Aspect | Fundamental analysis | Technical analysis |
| Main question | Is this company undervalued or overvalued? | Where is the price likely to move next? |
| Data used | Revenue, earnings, cash flow, debt, management, industry | Price, volume, volatility, market breadth |
| Time horizon | Months to years | Minutes to months |
| Typical users | Long-term investors, analysts, fund managers | Traders, market timers, risk managers |
| Key output | Intrinsic value estimate | Entry, exit and stop-loss levels |
| Professional designation | CFA charter | CMT designation |
Neither approach is guaranteed to work. Each has assumptions: fundamental analysis assumes prices eventually reflect value, while technical analysis assumes past price behaviour contains useful information about future moves.
Fundamental Analysis Tools
1. Company filings
Primary documents are the foundation. The US SEC's EDGAR system provides free public access to annual reports (10-K), quarterly reports (10-Q), insider ownership forms and other filings. Indian companies publish annual reports and disclosures through the NSE and BSE.
2. Stock screeners
Screeners filter thousands of companies by metrics such as P/E, return on equity or debt levels. Free screeners exist for both US and Indian markets, while paid versions add deeper histories and custom formulas.
3. Valuation models
Spreadsheets remain the analyst's core tool for discounted cash flow (DCF) models, comparable company analysis and dividend discount models.
4. Research platforms
Paid services such as Morningstar provide fair-value estimates, economic moat ratings and analyst commentary. Broker research reports are often included free with brokerage accounts.
Key fundamental metrics
| Metric | Measures | Watch out for |
| P/E ratio | Price relative to earnings | One-off profits distort it |
| EV/EBITDA | Value relative to operating earnings | Ignores capital spending needs |
| Free cash flow | Cash left after investment | Lumpy capital expenditure |
| ROE | Profitability on equity | High debt can inflate it |
| Debt-to-equity | Financial leverage | Differs widely by industry |
Technical Analysis Tools
1. Charting platforms
Charting software displays candlestick, bar and line charts with indicators and drawing tools. Schwab's thinkorswim, for example, offers hundreds of technical studies and drawing tools. Standalone platforms such as TradingView and broker platforms like Zerodha Kite provide similar charting for different markets.
2. Indicators
| Indicator | Type | Common use |
| Moving averages (50-day, 200-day) | Trend | Identify direction and support or resistance |
| Relative Strength Index (RSI) | Momentum | Spot overbought or oversold conditions |
| MACD | Trend and momentum | Detect changes in momentum |
| Bollinger Bands | Volatility | Measure price extremes relative to recent range |
| Volume and on-balance volume | Participation | Confirm strength of a move |
3. Scanners and alerts
Technical scanners search for patterns such as breakouts above resistance or moving-average crossovers, and alerts notify you when a price level is reached.
4. Backtesting tools
Backtesting applies a rule-based strategy to historical data. It is useful, but results can be misleading if the rules are over-fitted to past data or ignore costs and slippage.
Combining Both: A Practical Example
Karan, an investor in India, wants to buy a large private-sector bank.
1. Fundamental step: he reads the bank's annual report, compares its return on assets, asset quality and price-to-book ratio with peers, and concludes it is reasonably valued with stable growth.
2. Technical step: on the chart, the stock trades well above its 200-day moving average but has just risen sharply, with RSI near overbought territory. Instead of buying immediately, he sets a limit order near a prior support level.
3. Risk step: he places a stop-loss below the support zone, so that if the trend breaks, his loss is capped at a level he has decided in advance.
Fundamentals decided what to buy; technicals shaped the entry and exit plan.
Pros and Cons
Fundamental analysis tools
- Pros: grounded in business reality; suited to long-term wealth building; widely respected
- Cons: time-consuming; markets can ignore value for long periods; depends on accounting quality
Technical analysis tools
- Pros: clear entry and exit levels; applicable to any liquid market; useful for risk control
- Cons: indicators can give false signals; prone to over-fitting; ignores business quality
How to Choose Your Toolkit
- Long-term investor: filings, a screener, a spreadsheet and one research service; basic charts for entry timing.
- Swing trader: charting platform, scanners and alerts, plus a quick fundamental check to avoid weak companies.
- Day trader: advanced charting, real-time data and Level II quotes; fundamentals mainly for news awareness.
Common Mistakes When Using Analysis Tools
- Indicator overload. Stacking five momentum indicators rarely adds information, because most are calculated from the same price data. Two or three complementary tools are usually enough.
- Ignoring the reporting calendar. A clean chart pattern can be overturned by a quarterly result. Check upcoming earnings dates before placing a technical trade.
- Treating a low P/E as a bargain. A cheap valuation can reflect falling profits, high debt or governance concerns. Read the notes to the accounts before concluding a stock is undervalued.
- Backtesting without costs. Brokerage, taxes, spreads and slippage can turn a profitable-looking strategy into a losing one.
- Copying screens blindly. A screener only reflects the rules you give it; understand why each filter is there.
Key Takeaways
- Fundamental tools estimate value; technical tools time decisions.
- EDGAR, exchange filings and screeners are the core free fundamental tools.
- Charting platforms, indicators and scanners are the core technical tools.
- Combining both approaches adds discipline to entries, exits and risk.
- No tool replaces a written plan with position sizing and stop-losses.
Frequently Asked Questions
Which is better, fundamental or technical analysis?
Neither is universally better. Fundamental analysis suits long-term investing, while technical analysis suits shorter-term trading. Many investors combine them.
What are the best free fundamental analysis tools?
SEC EDGAR for US company filings, NSE and BSE disclosures for Indian companies, and free stock screeners are strong starting points.
What are the most commonly used technical indicators?
Moving averages, RSI, MACD, Bollinger Bands and volume-based indicators are among the most widely used.
Can technical analysis predict stock prices?
It cannot predict prices with certainty. It identifies patterns and probabilities that traders use to plan entries, exits and risk.
Do professional investors use both methods?
Many do. Fund managers often use fundamental research for selection and technical signals or execution data for timing and risk control.
Financial Disclaimer
This article is for general information and education only and does not constitute investment, financial, legal or tax advice, or a recommendation to buy or sell any security. Investing in securities involves risk, including possible loss of principal. Fees, features, rankings and regulations cited were checked against the listed sources on 15 October 2026 and may change without notice. Verify current details with the provider or regulator and consider consulting a SEBI-registered investment adviser, a FINRA-registered professional or another qualified adviser before making financial decisions.
Source References
1. SEC EDGAR – Search filings — https://www.sec.gov/search-filings
2. Charles Schwab – thinkorswim — https://www.schwab.com/trading/thinkorswim
3. CFA Institute – CFA Program — https://www.cfainstitute.org/programs/cfa-program
4. CMT Association – CMT Program — https://cmtassociation.org/cmt-program/
5. Investor.gov (US SEC) — https://www.investor.gov/
All sources were accessed on 15 October 2026.
Suggested Internal Links
| Anchor text | Suggested URL |
| Paid vs Free Stock Research Services | /paid-vs-free-stock-research-services |
| Advanced Trading Platforms for Professional Investors | /advanced-trading-platforms-professional-investors |
| Stock Market Education for Beginners | /stock-market-education-beginners-guide |